Conventional PCR, Real-Time qPCR, RT-PCR, and Digital PCR: A Comparative Technical Reference for Experimental Design
Conventional PCR, Real-Time qPCR, RT-PCR, and Digital PCR: A Comparative Technical Reference for Experimental Design
Polymerase chain reaction methodology has diversified substantially since its introduction in 1985. The four principal variants — conventional (endpoint) PCR, real-time quantitative PCR (qPCR), reverse-transcription PCR (RT-PCR), and digital PCR (dPCR) — address fundamentally different experimental questions and impose distinct requirements for instrumentation, reagent selection, and data analysis. Selecting the appropriate methodology requires understanding not merely what each technique measures, but the nature of the quantitative information each provides and the sources of error that limit its interpretation.
This reference compares the four methodologies across their analytical principles, performance characteristics, and appropriate applications, with particular attention to the common misunderstandings that lead to method misapplication — especially the persistent confusion between RT-PCR (reverse transcription) and real-time PCR (quantitative), which share the same abbreviation but describe orthogonal aspects of the experimental workflow.
1. Conventional (Endpoint) PCR: Presence/Absence Detection
1.1 Analytical Principle
Conventional PCR amplifies a target DNA sequence through repeated thermal cycles of denaturation (94–98°C), primer annealing (50–65°C), and extension (72°C). Detection occurs at the endpoint — after all cycles are complete — by separating amplification products via agarose or polyacrylamide gel electrophoresis and visualizing with intercalating dye (ethidium bromide, SYBR Safe, GelRed). The presence of a band at the expected molecular weight indicates target amplification; its absence indicates non-amplification.
The critical analytical limitation is that endpoint detection provides binary information only: target present or target absent. The relationship between band intensity and starting template quantity is non-linear and unreliable. During the plateau phase of PCR — which is reached after approximately 25–35 cycles for most reactions — amplification efficiency drops to near zero as polymerase activity declines, dNTPs are depleted, and product re-annealing competes with primer binding. Two reactions with 10-fold differences in starting template quantity may produce bands of indistinguishable intensity because both have reached the plateau by the detection timepoint.
1.2 Appropriate Applications
Conventional PCR is the appropriate method when the experimental question is strictly qualitative:
- Genotyping: Determining the presence or absence of a specific allele, transgene, or knockout construct. A 500 bp band indicates wild-type; a 300 bp band indicates the knockout allele. The relative intensity of the bands is irrelevant to the genotyping call.
- Colony PCR: Screening bacterial colonies for successful plasmid insertion before proceeding to miniprep and sequencing. Positive/negative discrimination is sufficient; quantification is unnecessary.
- Pathogen detection in high-copy-number infections: Confirming the presence of bacterial or viral DNA when the clinical question is detection, not quantification.
- Template preparation: Generating DNA amplicons for downstream cloning, sequencing library construction, or in vitro transcription.
1.3 Limitations for Quantitative Questions
A common error among new investigators is attempting to quantify gene expression by visually comparing band intensity on an agarose gel — running a conventional PCR for a target and a reference gene on the same gel, then concluding that target expression is "higher" or "lower" based on relative band brightness. This approach is semi-quantitative at best and actively misleading in most cases. Because amplification reaches plateau at different cycle numbers for different primer sets and template abundances, the relationship between band intensity and starting template concentration is non-monotonic and cannot be calibrated without a standard curve run to a common endpoint — at which point the method approximates qPCR but with substantially lower precision and dynamic range.
2. Real-Time Quantitative PCR (qPCR)
2.1 Analytical Principle
qPCR monitors amplification in real time during each thermal cycle by measuring fluorescence that is proportional to the quantity of double-stranded DNA product. Two detection chemistries predominate:
SYBR Green I (intercalating dye): Fluoresces approximately 1,000-fold more intensely when intercalated into double-stranded DNA than when free in solution. Fluorescence is measured at the end of each extension step. Because SYBR Green binds to any double-stranded DNA — including primer-dimers and non-specific amplification products — melt curve analysis (post-amplification temperature ramp with continuous fluorescence monitoring) is essential to verify product identity. A single sharp melt peak at the expected Tm indicates specific amplification; multiple peaks or peaks at unexpected Tm values indicate non-specific products.
TaqMan probe (hydrolysis probe, 5′ nuclease assay): A dual-labeled oligonucleotide probe (5′ fluorophore, 3′ quencher) anneals to the target sequence between the forward and reverse primers. During extension, Taq polymerase's 5′→3′ exonuclease activity cleaves the probe, separating fluorophore from quencher and generating fluorescence. Because signal is generated only upon probe hybridization to the specific target sequence, TaqMan assays eliminate the non-specific signal that complicates SYBR Green detection. The trade-off is higher cost per assay (probe synthesis) and reduced flexibility (new probes required for each target).
2.2 The Ct Value and Quantification Methods
The primary output of qPCR is the quantification cycle (Cq, also denoted Ct) — the cycle number at which the fluorescence signal crosses a defined threshold above baseline. The Cq value is inversely proportional to the logarithm of the starting template quantity: each 3.32 cycle decrease corresponds to a 10-fold increase in template (assuming 100% amplification efficiency, where product doubles each cycle).
Two quantification strategies are employed:
Absolute quantification: A standard curve — serial dilutions of a known-concentration template — is run on the same plate. The Cq values of the standards define the relationship between Cq and template quantity. Unknown sample concentrations are interpolated from this standard curve. This method requires accurate standard preparation and is sensitive to differences in amplification efficiency between the standard template and the sample template.
Relative quantification (ΔΔCt method): The Cq of the target gene is normalized to the Cq of one or more reference genes (ΔCt = Ct_target − Ct_reference). The normalized expression in the experimental condition is then compared to a calibrator condition (ΔΔCt = ΔCt_experimental − ΔCt_calibrator). Fold change is calculated as 2^(−ΔΔCt). The validity of this method depends critically on the assumption that reference gene expression is invariant across experimental conditions — an assumption that must be experimentally validated for each experimental system.
2.3 Reference Gene Validation
The most common analytical error in qPCR gene expression studies is the unvalidated use of reference genes. GAPDH, ACTB (β-actin), and 18S rRNA are widely employed as reference genes under the assumption of constitutive expression across all conditions. This assumption is demonstrably false in many experimental contexts: GAPDH expression varies with oxygen tension (hypoxia), cell density, and metabolic state; β-actin expression changes with cell proliferation rate and cytoskeletal reorganization; 18S rRNA expression differs from mRNA expression in its regulation and may be present in vast excess, making normalization technically unreliable.
Best practice, as codified in the MIQE guidelines (Minimum Information for Publication of Quantitative Real-Time PCR Experiments; Bustin et al., 2009, Clinical Chemistry), requires experimental validation of reference gene stability in the specific experimental system. A pilot experiment testing 3–5 candidate reference genes (e.g., GAPDH, ACTB, B2M, HPRT1, TBP) across all experimental conditions, followed by stability analysis using software such as geNorm, NormFinder, or BestKeeper, identifies the most stably expressed gene or gene combination. Normalization to the geometric mean of the two or three most stable reference genes is the current gold standard.
3. Reverse Transcription PCR (RT-PCR)
3.1 Clarifying the Terminology
The abbreviation "RT-PCR" is a persistent source of confusion in the molecular biology literature. It denotes Reverse Transcription PCR — a workflow in which RNA is first converted to complementary DNA (cDNA) by reverse transcriptase, and the resulting cDNA is then amplified by conventional or quantitative PCR. The "RT" refers to the template conversion step (RNA→cDNA), not to the detection method (real-time).
Thus, a complete experimental description requires specifying both the template conversion and the detection method: RT-PCR (reverse transcription followed by conventional endpoint PCR), RT-qPCR (reverse transcription followed by real-time quantitative PCR), or simply RT followed by downstream analysis. The distinction is not semantic — it determines the experimental design, controls required, and quantitative information obtained.
3.2 One-Step vs Two-Step RT-PCR
| One-Step RT-PCR | Two-Step RT-PCR | |
|---|---|---|
| Workflow | Reverse transcription and PCR amplification occur sequentially in the same tube, using a single enzyme mix containing both reverse transcriptase and DNA polymerase | Reverse transcription is performed first in a separate tube; an aliquot of the resulting cDNA is then transferred to a PCR reaction |
| Advantages | Fewer pipetting steps → lower contamination risk; faster setup; suitable for high-throughput and clinical applications | cDNA can be used for multiple PCR reactions (different targets); RT and PCR conditions can be optimized independently; cDNA can be stored for future experiments |
| Disadvantages | Entire RT reaction consumed in a single PCR; cannot re-test the same cDNA with different primers; RT and PCR conditions cannot be independently optimized | Additional pipetting step introduces contamination risk; requires more hands-on time |
| Best for | Clinical diagnostics (fixed targets, high throughput); gene expression panels where all targets are defined in advance | Research applications requiring flexibility; experiments where the same cDNA will be screened with multiple primer sets; archival cDNA banking |
3.3 Reverse Transcriptase Selection
The choice of reverse transcriptase affects cDNA yield, length, and representation. Moloney Murine Leukemia Virus reverse transcriptase (M-MLV RT) and its engineered derivatives are the most commonly used enzymes. Wild-type M-MLV RT has an optimal temperature of approximately 37–42°C and is susceptible to premature termination at regions of RNA secondary structure. Engineered variants — such as SuperScript (Thermo Fisher) and ProtoScript II (NEB) — incorporate mutations (D524G, E562G, and others) that increase thermostability to 50–55°C, reducing secondary structure interference and improving full-length cDNA synthesis. Avian Myeloblastosis Virus reverse transcriptase (AMV RT) operates at 42–60°C, providing an alternative for GC-rich or highly structured RNA templates.
3.4 Genomic DNA Contamination and No-RT Controls
RNA preparations invariably contain residual genomic DNA (gDNA) unless specifically treated with DNase I. In RT-qPCR, this gDNA serves as a PCR template and produces signal indistinguishable from cDNA-derived amplification. The resulting overestimation of transcript abundance can be substantial — particularly for genes with low expression levels, where gDNA signal may exceed the genuine cDNA signal.
The no-RT control (+RNA, −reverse transcriptase) is the essential diagnostic for gDNA contamination. By omitting reverse transcriptase from the RT reaction, any subsequent PCR amplification must originate from gDNA, not from cDNA. A positive no-RT control invalidates the corresponding +RT sample; the experiment must be repeated with DNase-treated RNA. The MIQE guidelines recommend reporting no-RT control results in qPCR publications as a quality metric.
4. Digital PCR (dPCR): Absolute Quantification Without Standards
4.1 Analytical Principle
Digital PCR represents a conceptual departure from qPCR. Rather than monitoring amplification in real time within a single reaction volume, dPCR partitions the reaction into thousands of discrete microreactors — droplets (droplet digital PCR, ddPCR; Bio-Rad QX200) or nanowells (chip-based dPCR; Thermo Fisher QuantStudio 3D, Roche Digital LightCycler) — such that each partition contains either zero or one (statistically, ≤1) target molecules. Standard endpoint PCR amplification is performed simultaneously in all partitions. After amplification, each partition is scored as positive (fluorescence above threshold) or negative (no fluorescence). The absolute target concentration in the original sample is calculated from the fraction of positive partitions using Poisson statistics.
The key analytical distinction from qPCR: dPCR provides absolute quantification without requiring a standard curve. Because quantification derives from counting positive vs negative partitions — not from comparing Cq values — dPCR is inherently robust to variations in amplification efficiency and to the presence of PCR inhibitors that shift Cq values in qPCR.
4.2 Performance Characteristics
| qPCR | dPCR | |
|---|---|---|
| Quantification basis | Cq value (relative to standard curve or reference gene) | Partition counting + Poisson statistics (absolute) |
| Precision at low copy number | CV 10–30% below 10 copies/reaction | CV 5–15% at 1–10 copies/reaction |
| Inhibitor tolerance | Sensitive — inhibitors shift Cq, reducing accuracy | Tolerant — endpoint detection unaffected by efficiency variation |
| Dynamic range | ~6–7 log₁₀ (10¹–10⁷ copies) | ~4–5 log₁₀ (limited by partition count) |
| Multiplexing capacity | 3–5 targets (limited by spectral overlap) | 2–3 targets on current commercial platforms |
| Cost per sample | $0.50–5.00 | $3–15 |
| Instrument cost | $15,000–60,000 | $60,000–120,000 |
4.3 Appropriate Applications for dPCR
dPCR provides decisive advantages in three specific analytical scenarios where qPCR underperforms:
Rare mutation detection (liquid biopsy, minimal residual disease): dPCR can detect a single mutant molecule in a background of 10,000–100,000 wild-type molecules (0.01–0.001% allele frequency). qPCR, limited by the precision of Cq discrimination, typically resolves mutations at ≥1% allele frequency. This 100–1,000-fold improvement in sensitivity has established dPCR as the reference method for EGFR T790M monitoring in non-small cell lung cancer and for BCR-ABL quantification in chronic myeloid leukemia.
Copy number variation with <2-fold differences: qPCR cannot reliably distinguish a 5-copy from a 6-copy gene duplication because the expected Cq difference (ΔCt ≈ 0.26 cycles at 100% efficiency) falls within the technical noise of the assay. dPCR, by directly counting positive partitions, resolves these differences through increased partition count statistics.
Viral load quantification in inhibitor-containing matrices: Plasma, soil, food, and formalin-fixed paraffin-embedded (FFPE) tissue samples contain PCR inhibitors that shift Cq values and distort standard curves. dPCR endpoint detection is robust to these inhibitors, providing accurate quantification without requiring inhibitor removal or standard curve generation.
5. Methodology Selection by Experimental Question
| Experimental Question | Starting Material | Recommended Method | Key Controls |
|---|---|---|---|
| Is this mouse wild-type, heterozygous, or knockout? | Genomic DNA | Conventional PCR + gel | Positive control (known genotype), NTC |
| Does this bacterial colony contain my plasmid insert? | Colony DNA (boilate) | Conventional PCR + gel | Positive colony, empty vector control |
| Is Gene X expression higher in treatment vs control? | RNA → cDNA | RT-qPCR (ΔΔCt) | No-RT control, validated reference genes, NTC |
| How many viral genome copies per mL of patient plasma? | RNA or DNA | RT-qPCR (standard curve) or dPCR | Quantified standard, extraction control |
| Does this tumor harbor the EGFR T790M mutation at low frequency? | Genomic DNA | dPCR | Wild-type control, mutant control, NTC |
| Is this patient sample positive for SARS-CoV-2 RNA? | RNA | One-step RT-qPCR | Positive control, extraction control, NTC |
| How many copies of this transgene integrated into the genome? | Genomic DNA | dPCR or qPCR (standard curve) | Reference gene (known copy number), NTC |
| I need 5 µg of this PCR product for cloning. | Plasmid or cDNA | Conventional PCR (preparative scale) | NTC, analytical gel before scale-up |
6. Common Methodological Errors and Their Consequences
Several recurring errors in PCR experimental design produce results that appear statistically significant but are analytically invalid:
Using conventional PCR for "semi-quantitative" expression analysis. Visual comparison of band intensity on a gel is not quantification. The non-linear relationship between template abundance and endpoint band intensity produces false-negative conclusions (no difference detected when a real difference exists) and false-positive conclusions (apparent differences that reflect cycle number selection rather than template abundance). Gene expression comparisons require qPCR or dPCR.
Using qPCR for genotyping. If the analytical question is presence/absence — which allele, which genotype — the additional quantitative information provided by qPCR carries no analytical value and the per-reaction cost is 3–10× that of conventional PCR. Genotyping is a conventional PCR application.
Omitting no-RT controls in RT-qPCR experiments. Genomic DNA contamination in RNA preparations is universal, not exceptional. Failure to run no-RT controls means that gDNA-derived signal is interpreted as transcript abundance, systematically inflating expression estimates — and the inflation is target-specific (genes with intron-spanning primers are protected; genes amplified with intronless primers or primers within a single exon are fully susceptible). Published RT-qPCR studies without reported no-RT control data should be interpreted with appropriate skepticism.
Assuming reference gene stability without experimental validation. The ΔΔCt method assumes that reference gene expression is constant across all experimental conditions. This assumption must be validated, not assumed. The MIQE guidelines require reporting of reference gene validation data; journals increasingly enforce this requirement during manuscript review.
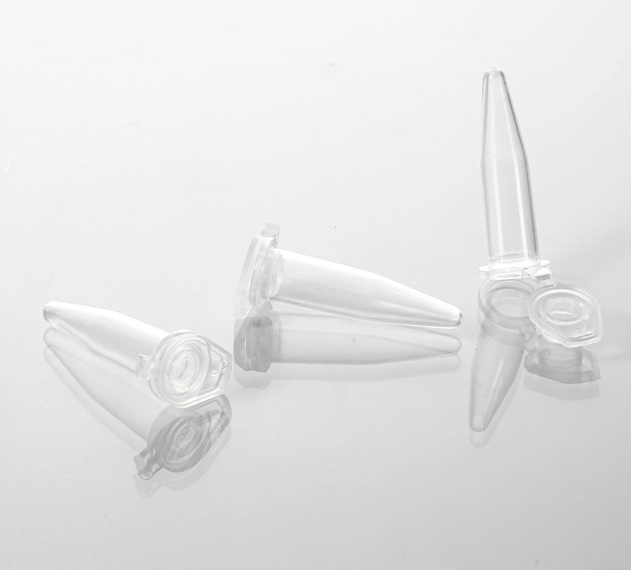
Additional resources: MUHWA provides certified PCR consumables for all four methodologies. 0.5mL Thin-Wall PCR Tubes (virgin polypropylene, RNase/DNase-free, non-pyrogenic, 1000/pack) are suitable for conventional PCR, qPCR, and RT-PCR applications. Lot-specific certificates of analysis are available upon request.
This technical reference is provided for educational purposes. PCR methodology selection for clinical diagnostic applications must comply with relevant regulatory frameworks and use validated, approved assays. For research applications, the MIQE guidelines (Bustin et al., 2009) provide the current consensus standard for qPCR experimental design and reporting. dPCR guidelines (dMIQE; Huggett et al., 2013) extend these principles to digital PCR workflows.
#PCR #qPCR #RT-PCR #digital PCR #dPCR #molecular biology methods #gene expression #experimental design #MIQE guidelines #laboratory techniques
Comments
Post a Comment